All posts by Dan

Fire conferences and presentation videos: Remembering Wildland Fire Canada 2016

I just returned from a conference (IAWF 18th Wildfire Safety Summit / 7th Human Dimensions Conference, Calgary, 2025), and had a great time! Kudos to Mikel and the other staff from the IJWF who worked hard and put on an excellent event. As before, I met with old friends and colleagues, met some new ones, and it got me thinking about wildland fire conferences and workshops in general. Most acutely, I’m recalling all the work, successes and challenges associated with being co-chair of the 2016 Wildland Fire Canada conference (WFC2016: Building Resilience, Kelowna, BC). I’m also hoping my memories of this conference don’t fade too quickly. I’m just a bit sad that I didn’t see much evidence of video recording (phones, cameras, whatever) of the various presentations and don’t trust my notes to be much help; but more on that later.

After WFC2016, it took 3 years (instead of the customary 2) to get the next WFC conference held (WFC 2019: Ottawa, ON), and that was the last one that was co-hosted by agencies and the CFS. Ever since 2022 (Edmonton, AB, the Covid-era conference), the event planning has been handled by the International Associated of Wildland Fire. As for the program, venue hosting and theme, the details are murky to me, but it appears that the CFS has largely taken these over (don’t quote me on this).

What happened in the lead up to 2016 in Kelowna? Predictably, it was a tonne of work, as my co-chair Kendrick Brown and I travelled around the BC interior visiting hotels, conference facilities, field trip venues, and wineries (that part wasn’t bad) to put it all together. A separate committee was building the technical program, and we worked together to invite gues speakers and solicit workshops. We debated room layouts, entertainment, A/V setup facilities, and schedules, and most of all – trying to guess how many people would pay the $500-$700 conference fee and actually show up. Neither Kendrick nor I had much experience in event planning, but we did get some good advice from industry professionals as well as – critically – an organization (CIFFC) willing to backstop the event with an initial loan and corporate guarantee. Like, if another 9/11 or Covid-19 type event happened a week before the conference and we had to cancel everything, the hotel and other businesses were going to want their pound of flesh. Someone had to be ready to take on the risk of booking hotel rooms and hiring guest presenters.

At the end of the day, of course, WFC2016 was a big success, the largest attendance of any Canadian wildfire conferences at the time, with the only hiccup being the rained out field trip.

Field trip attendees at a wildfire conference stand around in the rain at a burn site.

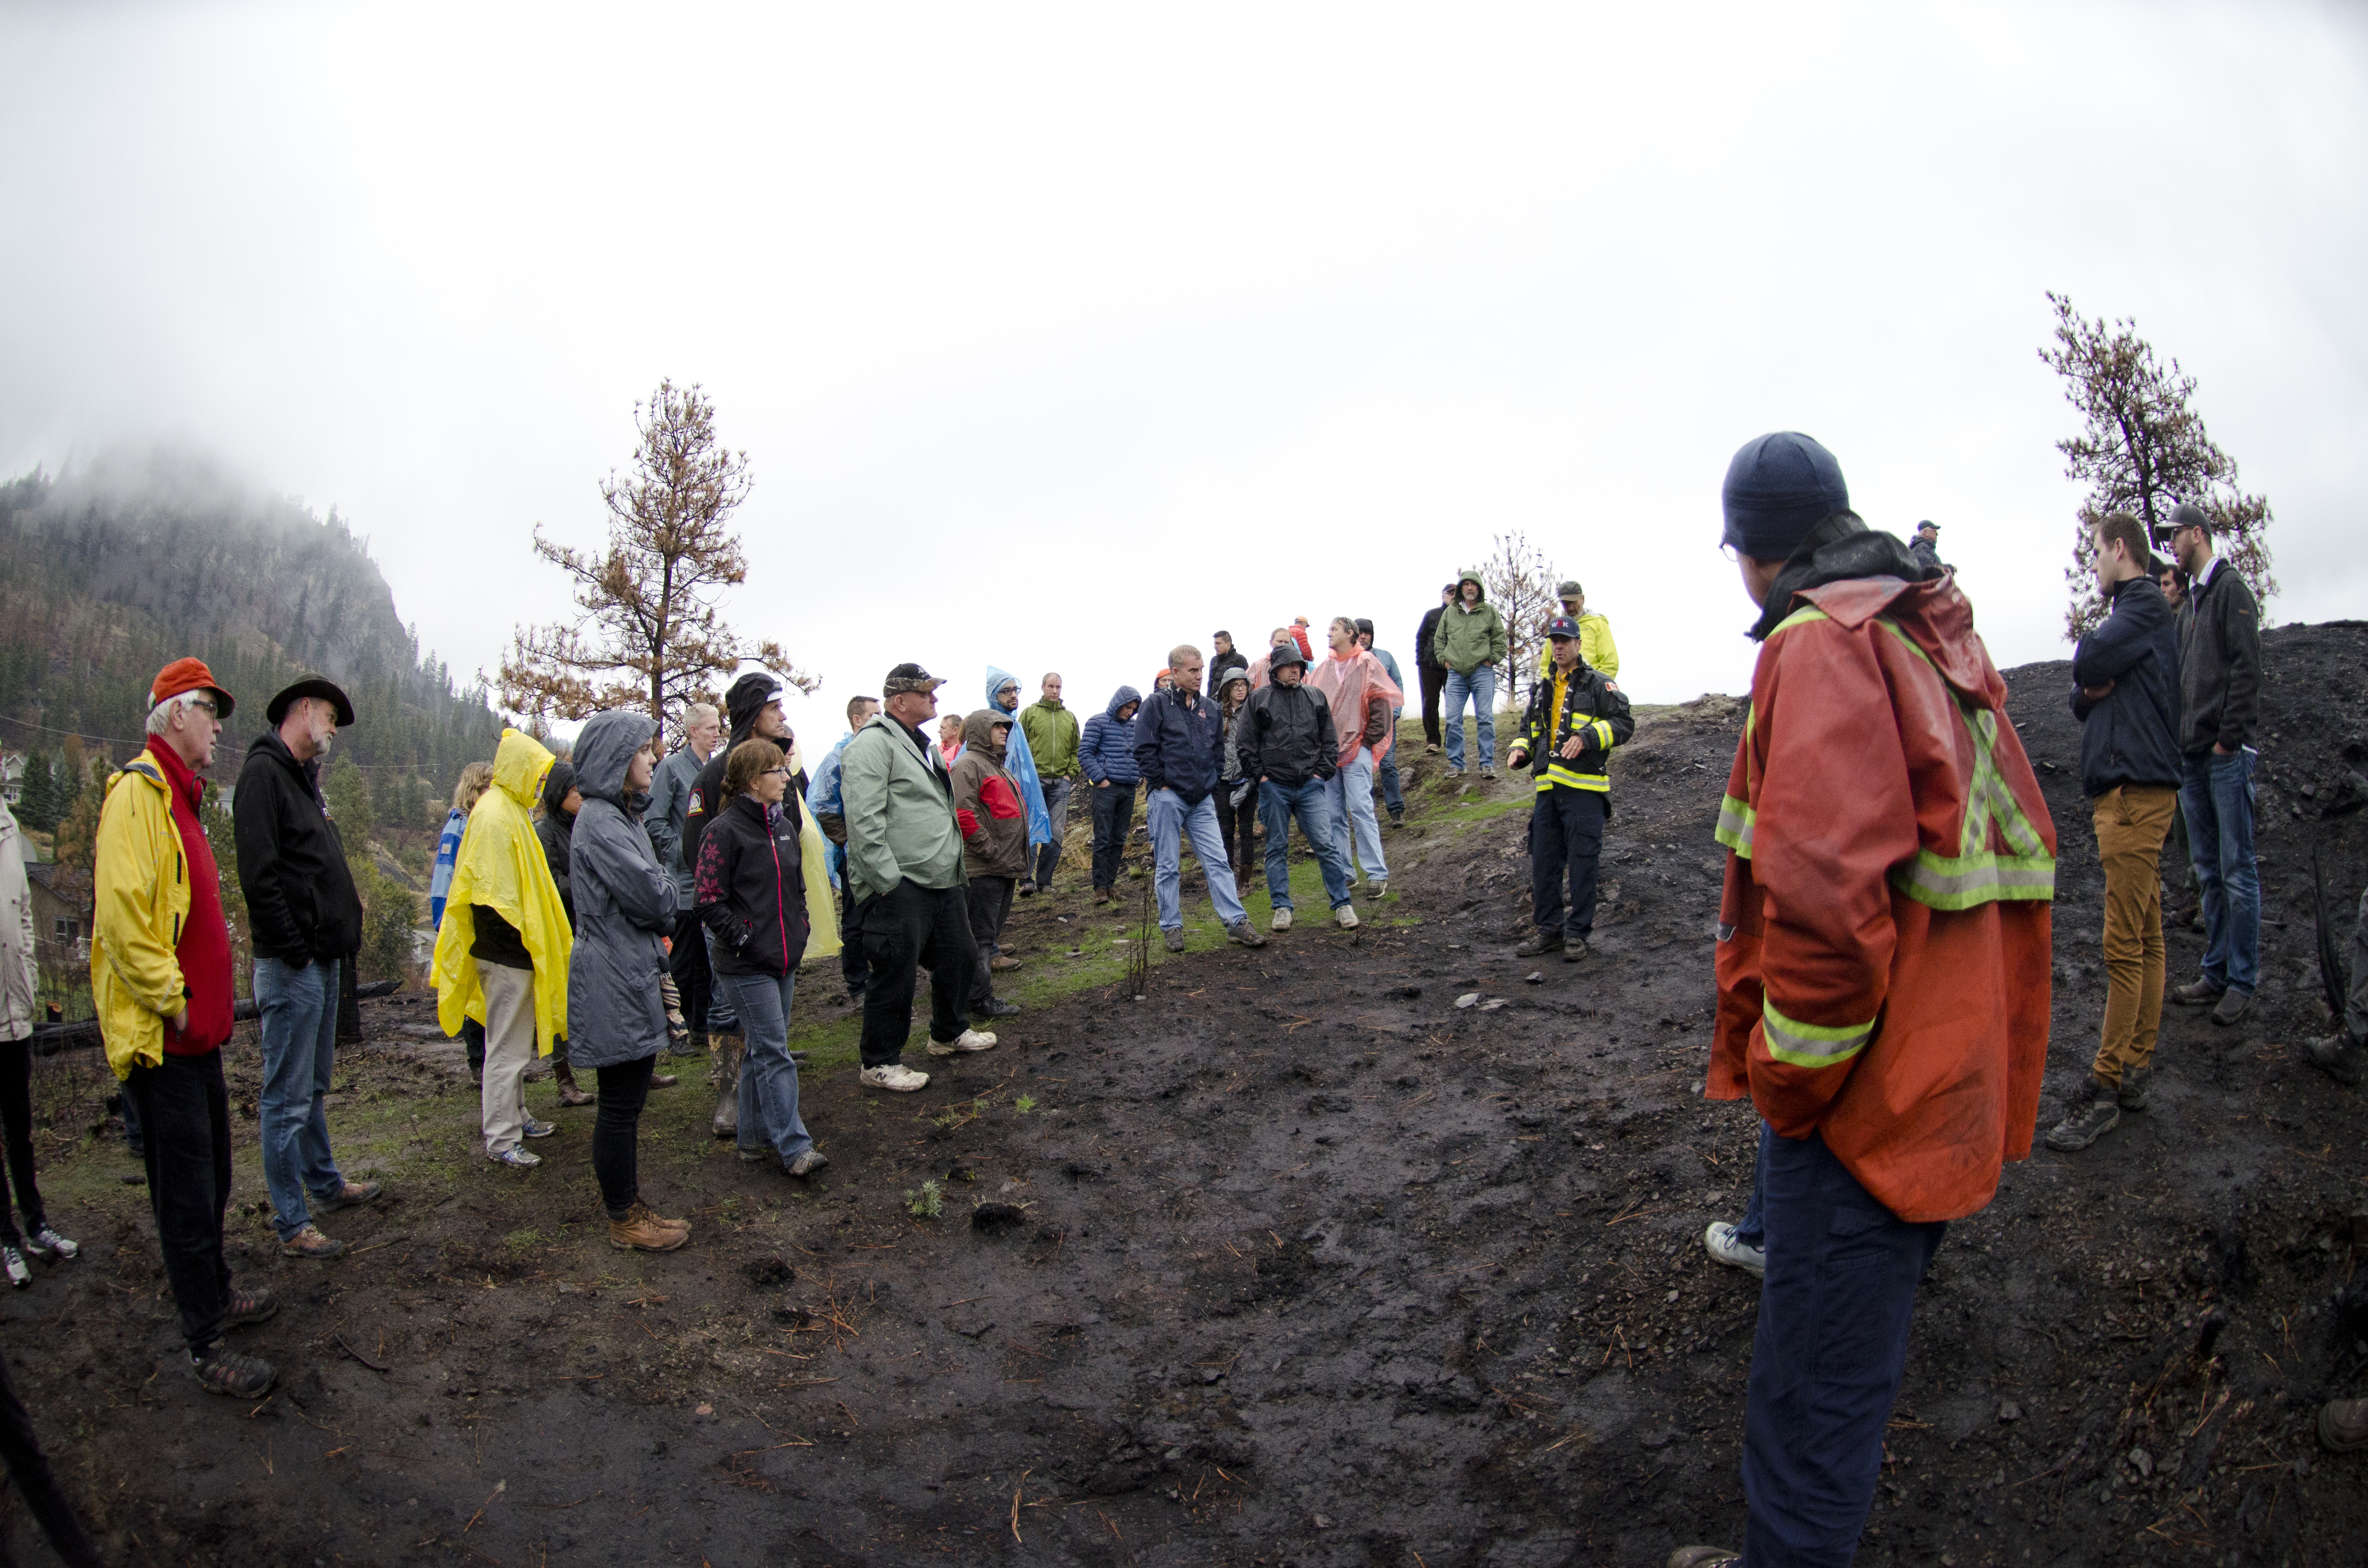
WFC2016 field trip. The wettest day of the whole month in normally-dry Kelowna, BC.

There was a small video component, where we managed to capture some sessions and publish them online for posterity; it was mainly for the plenary guest speakers, but also a few technical sessions. We had a couple of actual video cameras and I recall asking a student helper to run around with a tripod. It was just a bit early for everyone to be able to do this trivially with mobile phones.

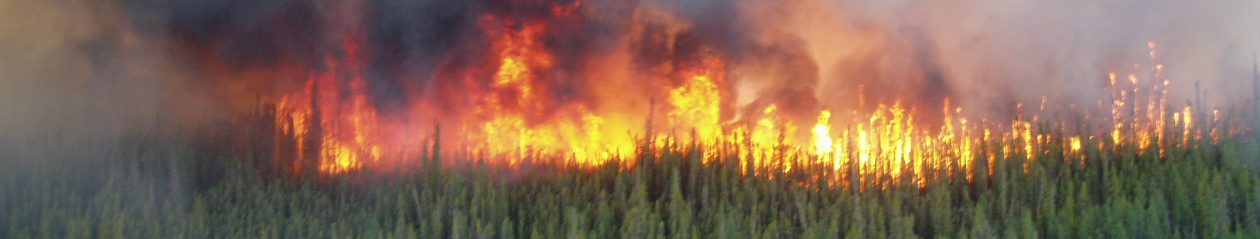
Some 300+ people got to watch Cordy Tymstra, Mike Flannigan, and Al Westhaver present on the 2016 Horse River fire that occurred earlier that year. Francis Zwiers presented an important discussion on the statistics of event attribution, Carol Miller discussed fire ecology issues in wilderness areas (a talk that was interrupted by technical difficulties, and is actually smoother to watch on video than it was live), and some of the technical breakout sessions were captured as well. But so what? Why are these poorly-viewed videos being mentioned here when there are millions of other videos of YouTube and other platforms, including many on wildland fire topics?

Well, here’s my take as someone who’s attended about 15 wildfire conferences in the past 25 years. It’s awfully hard to remember what you saw, even a few weeks later! Videos, if they existed, would be a valuable resource to help attendees recall and get maximum value from the time and expense invested in a conference trip.

In my experience, the first day of a conference, typically, is full of energy, and everyone is dutifully attending all talks and taking notes, taking screenshots and asking questions. Even by that first afternoon, some folks have put away their notebooks and resort to simply watching, hoping to remember the key points for later recall. But a couple of days later, after the banquet, the entertainment session, a couple of excellent plenaries and maybe 5 or 6 (or 15) technical sessions, it’s all you can do to actually attend and not stay in your room or head to the bar with your friends. Late presenters definitely get the short end of the stick in terms of audience interest and energy.

Then there’s the issue of concurrent sessions – what do you do when there are two (or more) talks that you want to see simultaneously? Having 3 or 4 or more concurrent sessions is very common, so you can’t be everywhere. The most extreme example of ‘death by choice’ that I can recall was an AFE conference I attended some time ago with 10 concurrent sessions. (It was a fun conference, but I couldn’t help but think that any 2 people attending would probably have completely different experiences in terms of technical sessions. )

Even if you’ve taken great notes during some sessions, even a couple of months later it’s awfully hard to recall who gave which talk or showed that excellent graphic that made an impression that you’d love to revisit.

This is where the videos come in. It has never been easier to make or host high quality online content, allowing attendees to re-watch the sessions they found most profound. This way they might get to see the ones they missed because of conflicts or bad timing (“had to catch that early flight so I wouldn’t miss my daughter’s recital!”).

Why don’t all conferences retain video of the presentations? I can think of a few reasons – production costs, maintenance costs, permissions, etc.* It often just comes down to the work involved and lack of obvious demand for a service. But still – online tools are cheap and readily available, platforms such as YouTube are essentially free, and permissions can easily be sorted with some small print and a disclaimer. I remember an excellent IJWF conference in Marseille a few years ago where a small army of students were handling an excellent video team, ostensibly capturing every session on video (Christophe – where are these videos today??). At WFC2022, nearly all sessions were recorded. A link was provided with session videos available for later viewing for 6 months after the conference. That was better than nothing, though I’d love to go back and rewatch some of those videos today. But by 2025, the Wildfire Summit offered no recording capabilities.

Would it not be valuable to know that recordings exists from all conferences you attended? This makes sense if you were a paid attendee, right? Ah – but what if you weren’t there and didn’t pay? Should you get to see the content for free? We faced this question at WFC2016, ultimately deciding that videos would be viewable for paid attendees only for the first year and then free for all viewers thereafter. This, unfortunately, may have resulted in very low view counts! Well, you can’t win ’em all.

But still – shouldn’t all conference presentations be recorded for viewing as online videos? I suppose we could ask the same of other materials. Should all conferences have printed Proceedings (at least in pdf form; paper versions shipped for extra cost, ok?). In my view, the more media the better. If the work is important, you don’t just want to hear about it once at the conference, you want to be able to cite it and watch it all over again as needed. Some futurists tell us that scientific papers are obsolete; online data, tools, and technology are the future. A plethora of AI-based tools may be suggesting that future is here already. Personally, I’m not so certain for papers – there’s probably still a need for peer-reviewed formal descriptions of new ideas and understanding. But for the less formal work presented at conferences, and the ‘hard to publish’ stuff like software, databases, case studies, random fire media (who doesn’t love a great fire video clip?) and more speculative ideas, I’d certainly rather view a video (maybe with a nice pithy description phrase, in lieu of an abstract) than read a conference paper.

So this is my plea to conference organizers – let’s get volunteers at each venue (students are great) who can run video ops. They can be offered a discount, free banquet ticket, or free drink tickets, whatever, in exchange for setting up a phone for recording in each room where sessions are being held (100% coverage is less important than trying to get most talks covered). With a simple cloud storage account, everyone can upload their videos daily, and we end up with a permanent record for viewing in perpetuity.

Then we won’t have the 6-month hangover problem after each conference we attend, trying to recall if we were actually even there.

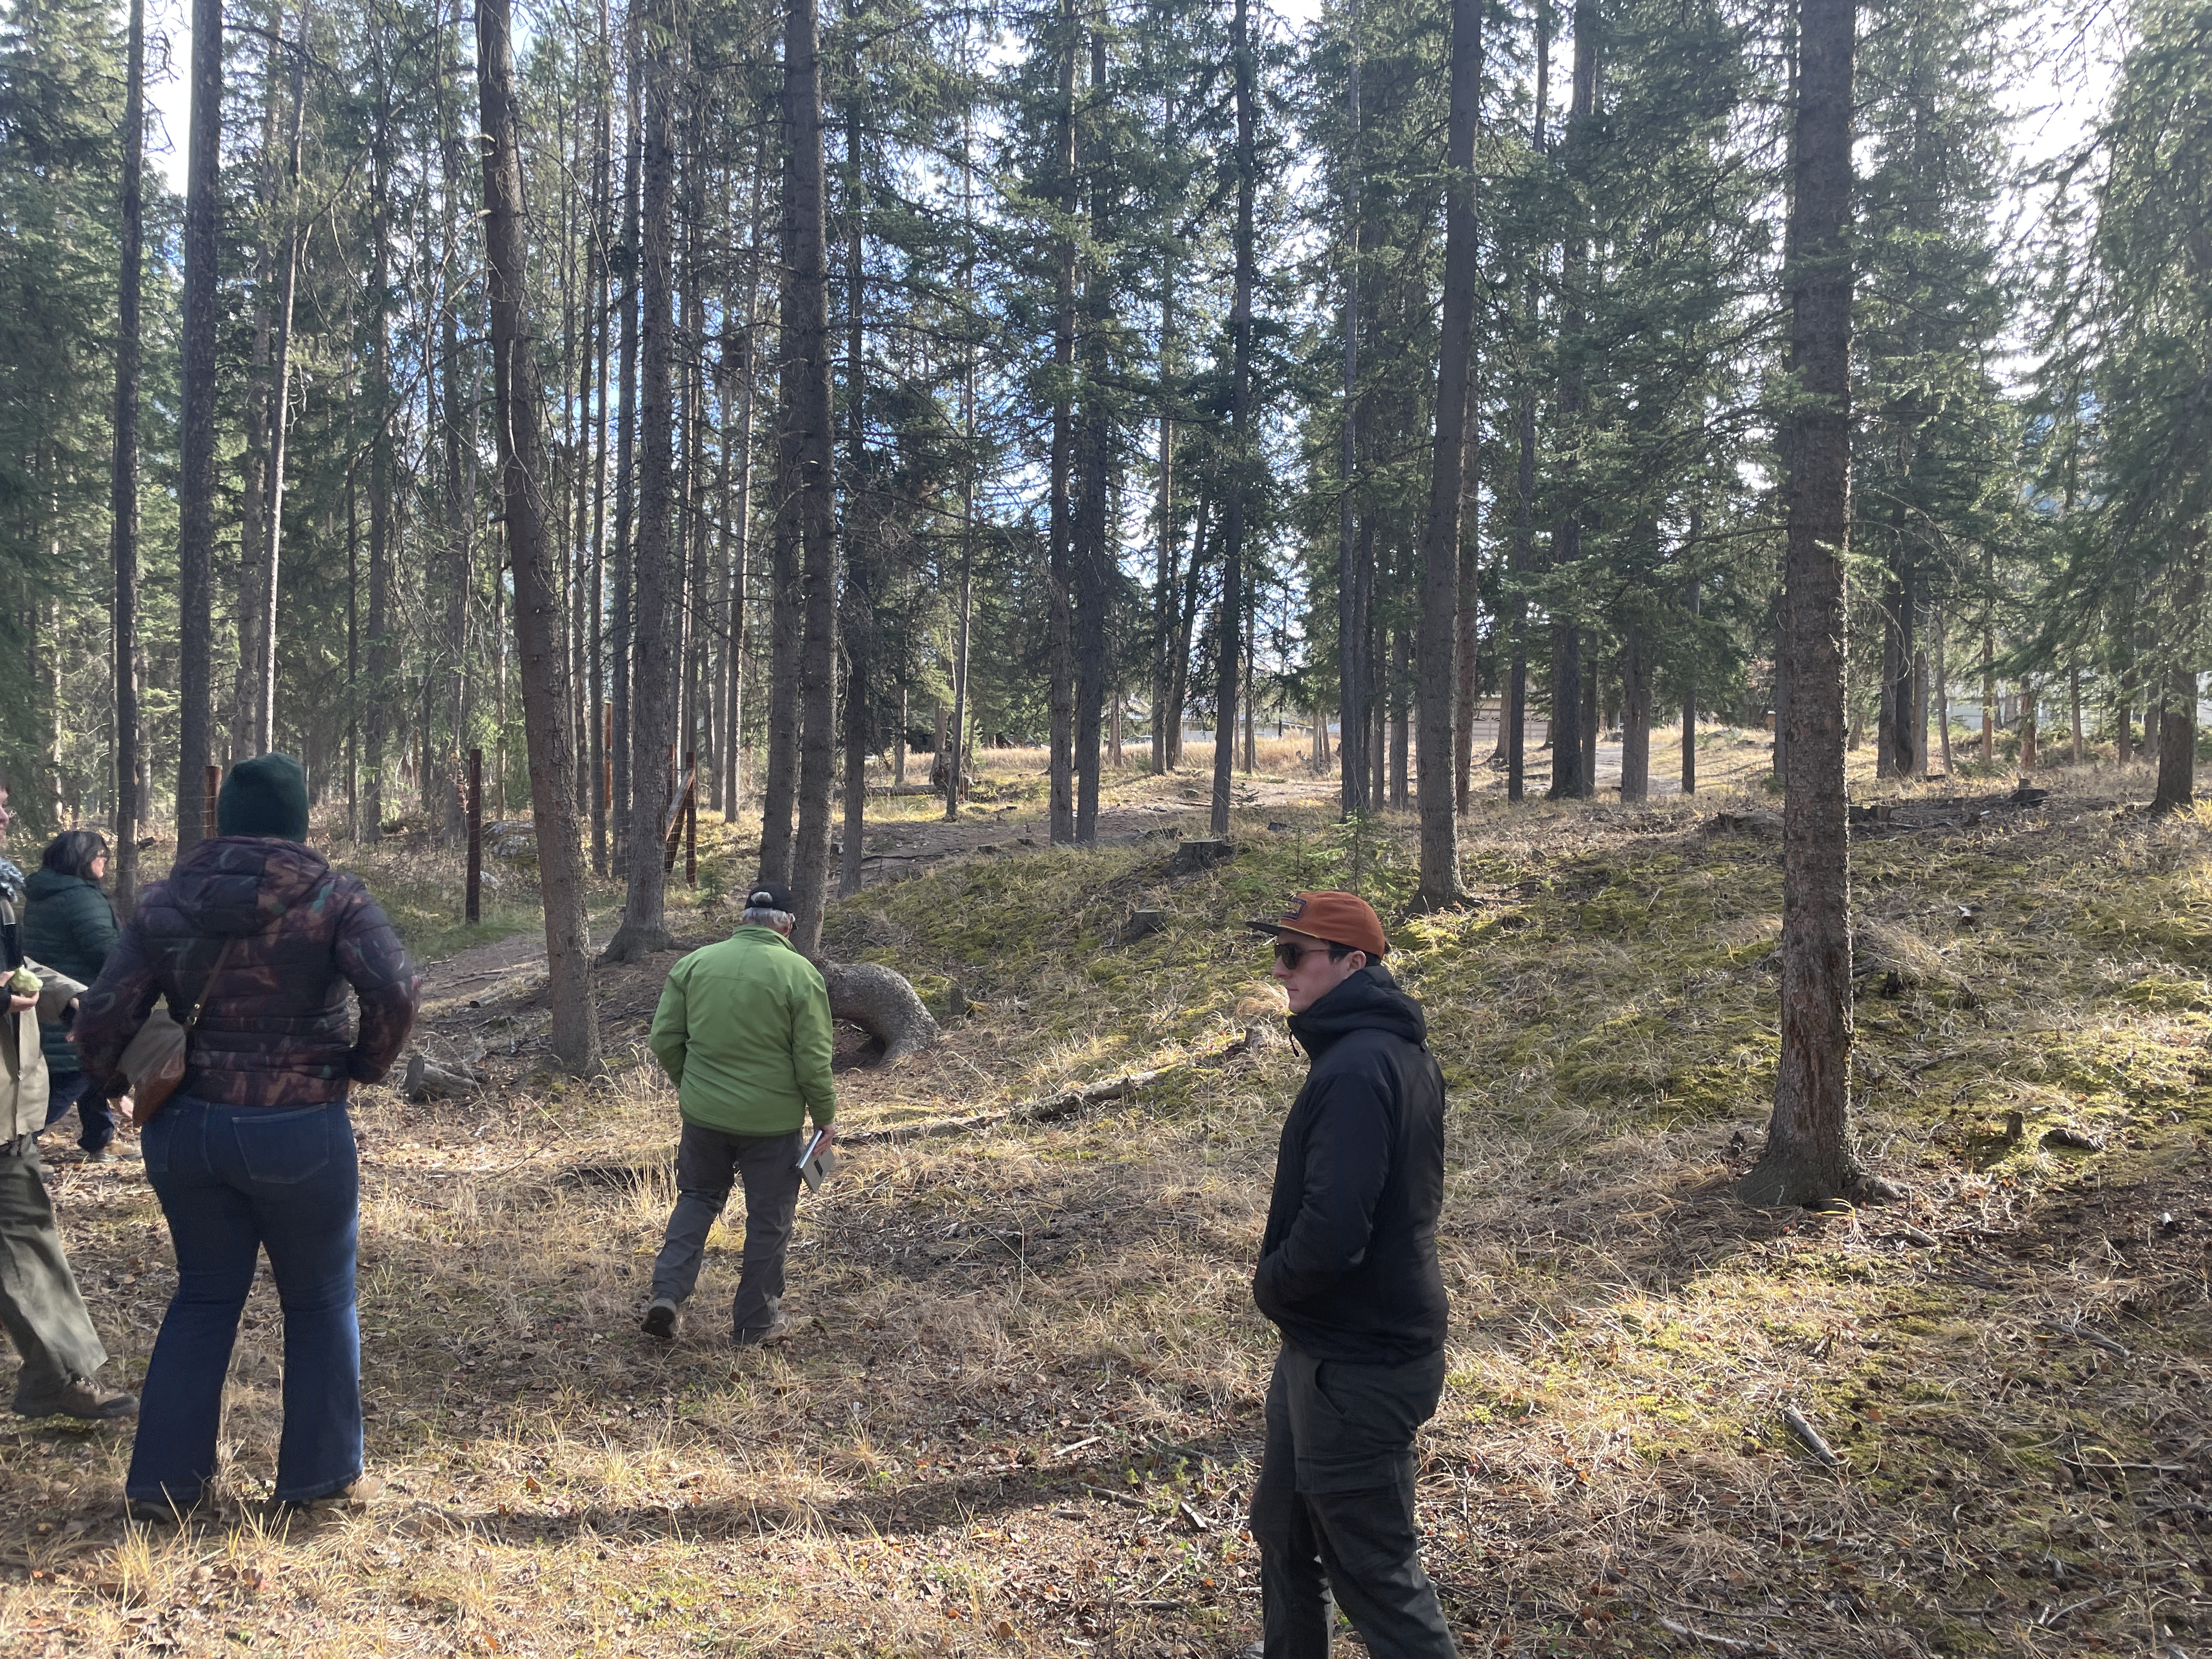
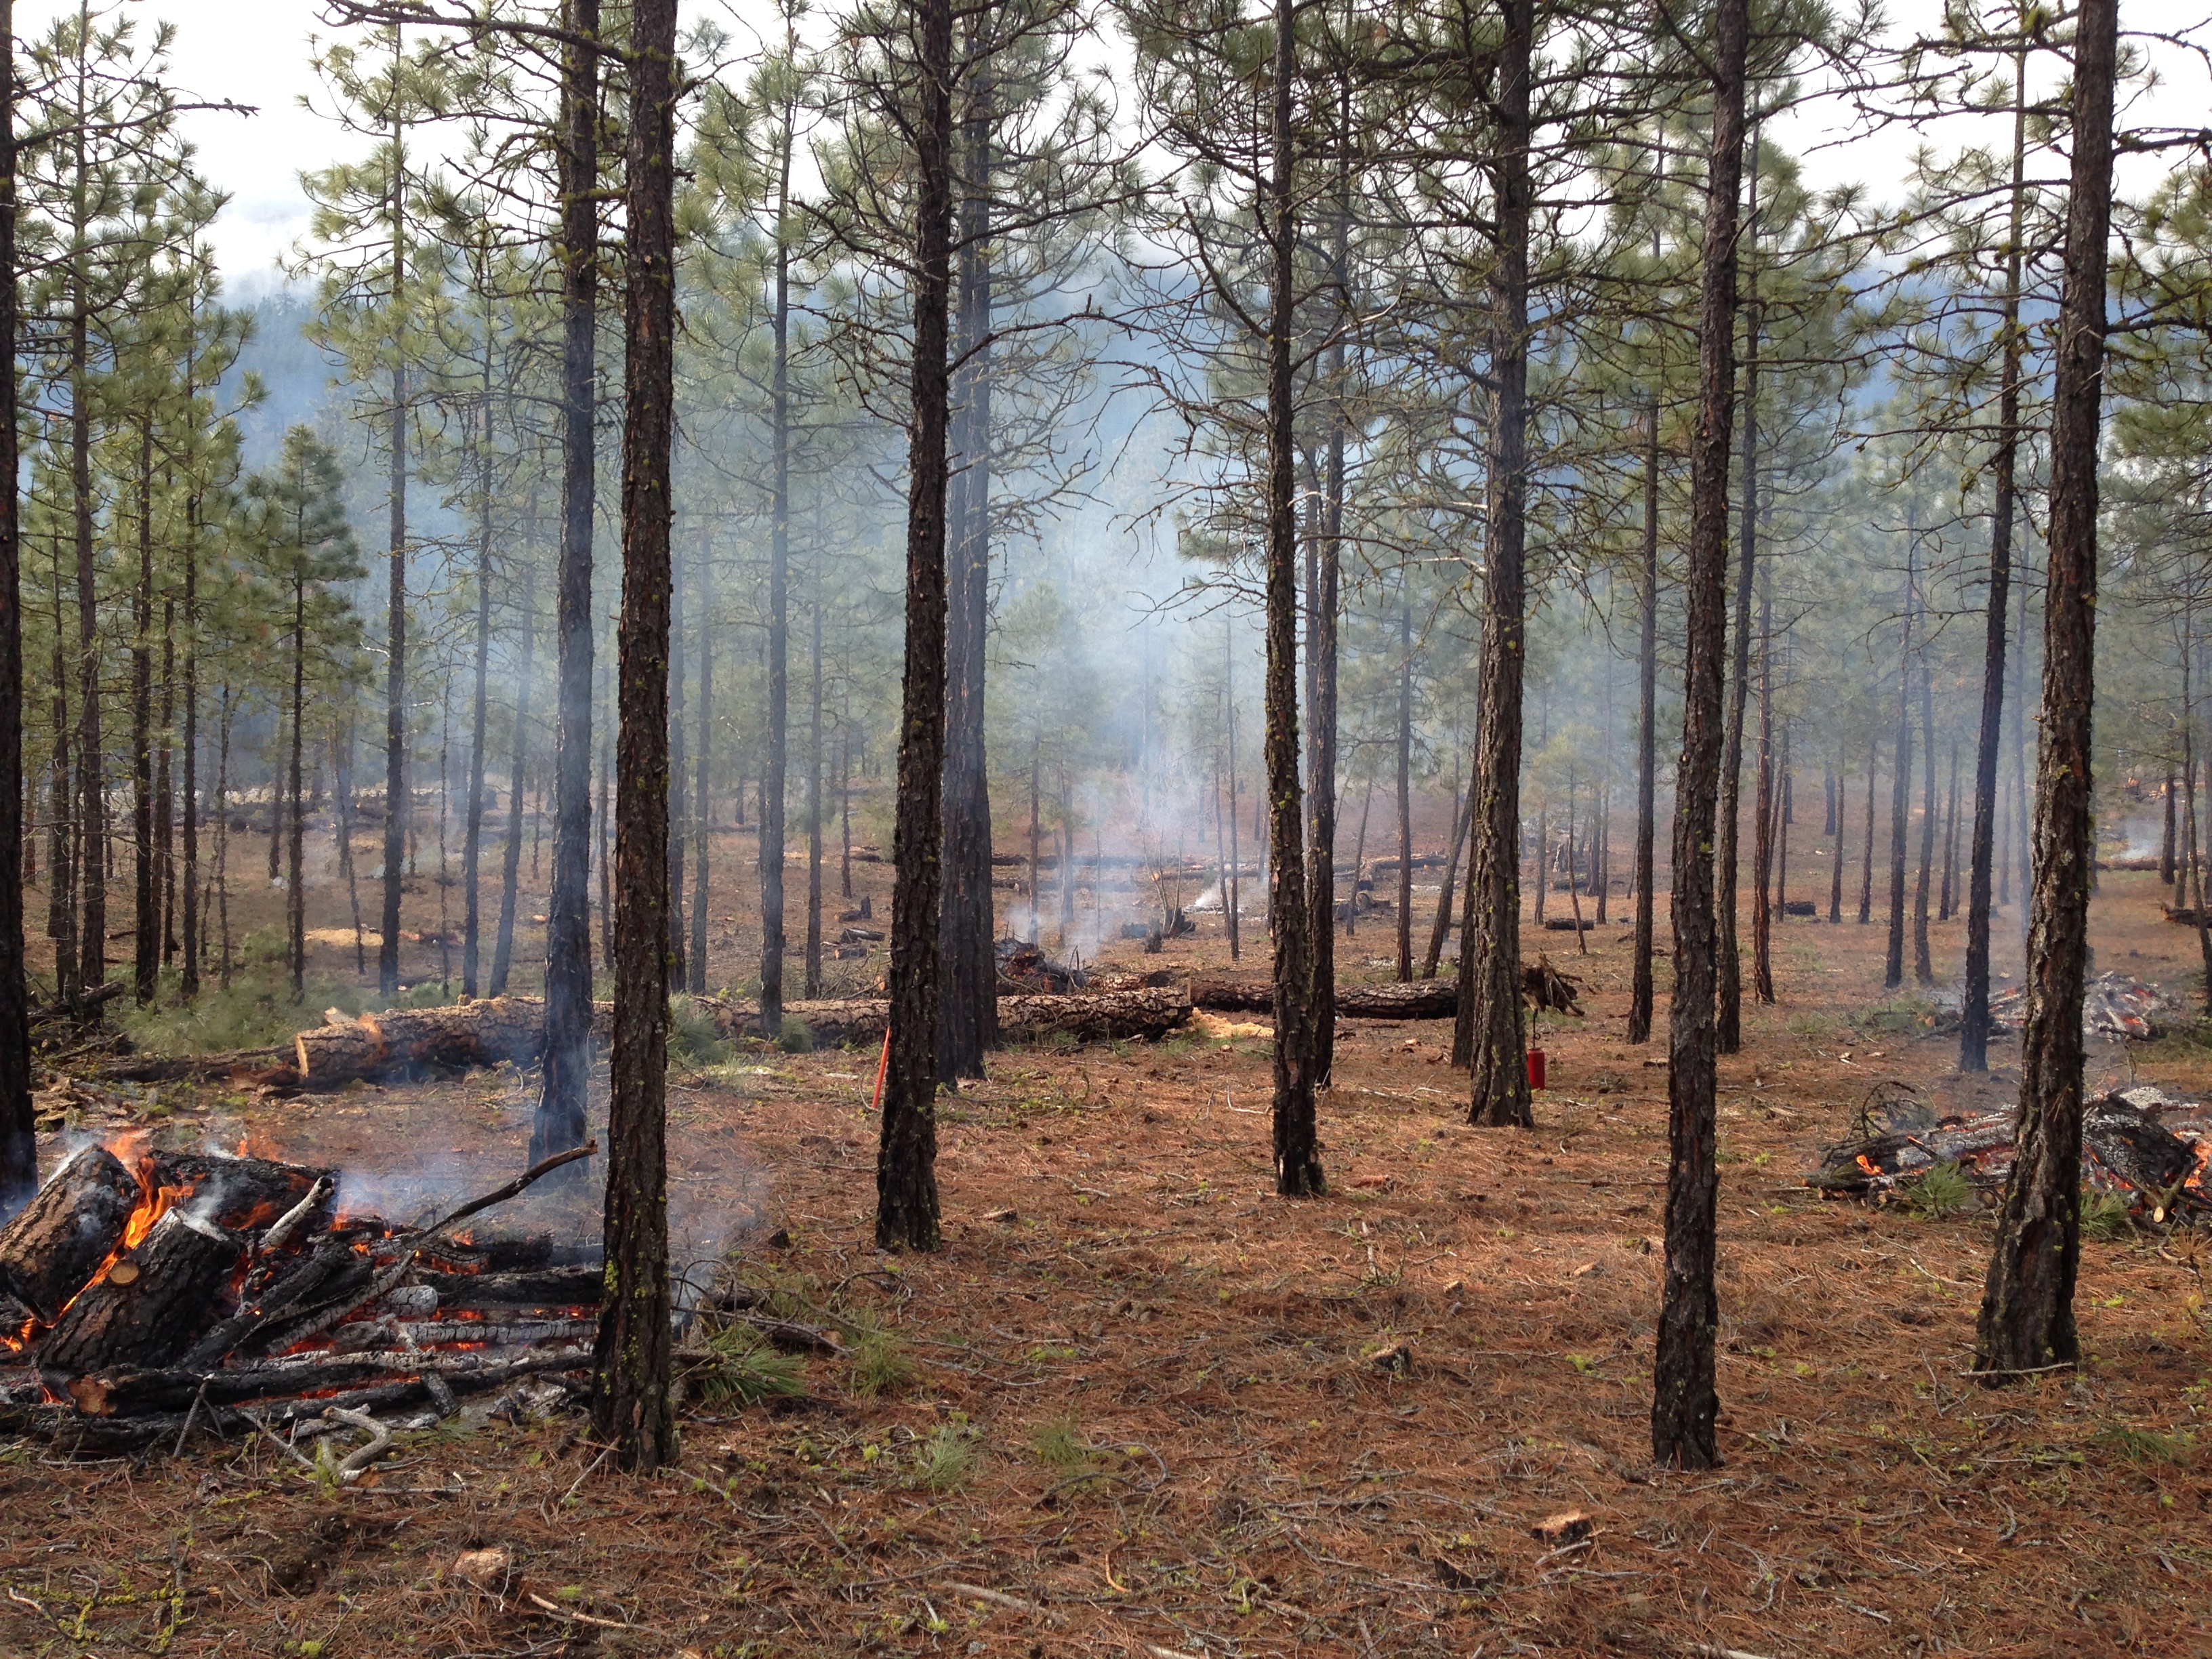
Enjoying the Wildfire Summit’s Banff field trip (Banff thinning project).

* Oh right – permissions. At WFC2016, we paid some money for well-known US author John McLean to come and give a keynote. He was working on another book, this time about the Yarnell Hill fire disaster in 2013. As part of his narrative, he named a witness and shared some photos this person took of the last minutes and hours of the Granite Mountain Hotshots. Well, a few months after our video went live, somehow this individual saw it (it only had 42 views at the time!) and filed a complaint with Vimeo (the platform we were using at the time). We had to take down the video and got threatened with litigation; we were mad, McLean was mad, the witness was mad, and the whole thing was a huge bummer. I guess sometimes permissions do need to be granted in writing. I still have the video, but sure won’t be posting it online anytime. Like I said before – you can’t win ’em all. Most videos can be shown with zero controversy, but sometimes you can get in trouble.

Gradually moving…

I’m gradually moving everything over to GitHub to facilitate code-sharing. I have an old ID (Fireecology1) that for some reason I have kept, and it seems to be working for me, though I still haven’t figured out all the business of forking and pulling and whatnot.

I apologize to anyone frustrated with this old and somewhat crappy blog page for lack of content and interest. It turns out that maintaining social media presence isn’t a major priority of mine. I was on the fence whether to put it out of its misery, but after resurrecting the ConPyro and FuelGraph links it seems like it’s still useful for some time.

For the latest FuelGraph-FBP, see here: https://github.com/Fireecology1/FuelGraph-FBP

For the latest Conifer Pyrometrics code and FuelGraph-CCP, see here: https://github.com/Fireecology1/ccp-prod .

Oregon 2020

It’s mid-September 2020, the tail end of the fire season and the end of the 6th month of the Covid19 (mis) adventure, at least from the western Canadian perspective.

Regardless what happens in the next month, the BC fire season is pretty much guaranteed to be a non-event from a statistical perspective. We are hovering around 610 fires, and about 13,500 hectares burned this year. Given that the averages sit at around 1800 fires and 50,000-200,000 ha burned, we are near the left tails of both of those distributions – one of the lowest years ever, in over 100 years of counting, from both the fire occurrence and area burned perspectives.

The same is not true for the western US. California is in the midst of another tragic year, with about a million hectares burned so far. Here’s a good article summarizing things, although it’s not breaking any new ground – we’ve known about the need for thinning and burning, and the effects of climate change, for at least a decade I’m sure. In the past two days, however, it’s Oregon that exploded with new fires and new huge fires.

East winds are brutal – they are the US PNW version of California’s ‘Santa Ana’ winds that cause such chaos down there. I was out in the field on the 8th when the high winds hit. On the southern tip of Vancouver Island, we could tell the strong and gusty winds from the east were bad news for the whole region.

I have very fond memories of my time playing and working hard in the Oregon Cascades, mostly 15-20 years ago. Tuesday’s (9/08) wind event was one of those ‘once in a century’ type explosive fire events that seem all too common in recent years. The news is now breaking that small towns in the Medford-Ashland corridor (Talent, Phoenix, Medford itself) had hundreds to thousands of homes burned in a single afternoon. What a tragedy for the area. I remember the area well and feel for the locals.

Here is a composite image I put together yesterday, with the MODIS and VIIRS hotspots in Google Earth overlaid with true colour MODIS/Terra imagery (from the NASA EOSDIS) showing the smoke plumes.

Canada (pretty much the whole country) got lucky this year. Hopefully we can help out our friends to the south. And let’s get on with the business of forest restoration and prescribed burning.

Wotton & Beverly (2007) moisture content adjustments

Edit June 15 – New simplified R code; see below.

This is something I’ve been working with recently as part of the CCP project, and I thought the code might be useful to others. I should get back into using Git and Github one of these days, but in the meantime, here’s some R code for those who want to play with this and are much too lazy to type out all the coefficients.

The Wotton & Beverly (2007) moisture content (WBmc hereafter) uses some forest stand composition, structure, and condition variables to modify the predicted moisture content estimated by the diurnal FFMC. The ‘generalized pine model’ has served us well for several decades (thank you, Charlie Van Wagner, James Wright, and others), but we’ve suspected for some time that stand factors play a role too. (If you don’t know what I’m talking about here, this probably isn’t for you). Ok, we’re talking about fire danger modelling using the Canadian Forest Fire Danger Rating System, and the FFMC is the Fine Fuel Moisture Code. Brush up on the FWI System basics if needed; here’s the technical report, and here’s  the  classic and much loved ‘mustache video’ (Intro to FWI System).

The WBmc estimates litter moisture, the most important fuel moisture variable for fire behaviour prediction. Their analysis was based on several thousand measurements from across Canada in the mid-20th century; as with the rest of the CFFDRS, it’s mostly focused on boreal forests, but not exclusively (there’s some BC data and some Great Lakes region data as well). Their model uses the following variables:

FFMC & DMC – by identifying DMC (Duff Moisture Code) as a significant variable , the authors found that drought or moisture in the duff layers (decomposing humus and fermentation layers in the forest floor) actually influences the moisture of the top litter layer. If it’s dry underneath, the litter is drier; if wet underneath, some of that moisture advects to the litter.

Forest stand type – pine, spruce, Douglas-fir (interior), mixedwood, or deciduous; admittedly, this list is limiting, and doesn’t get us entirely away from categorical fuel or vegetation types.

Stand densitylight, moderate, or dense stands; unfortunately, these categories aren’t very well defined either, as they were assigned from archived photos; as a working model, I’m using the tentative premise that this variable can be equated with the crown closure classification scheme (from the National Forest Inventory program): light ≈ Sparse (10-25% closure), moderate ≈ Open (26-60% closure), and dense ≈ Dense (61% or greater closure). I recently presented this to Mike Wotton, who said it made sense, but we’ll likely have to do some more field work to investigate this, and that may lead to a more usable continuous variable model for stand density.

Season – spring, summer, or autumn are significant on top of everything else; likely because of the greenup and leaf-out of broadleaf species in the overstory and understory, which add shade and in-stand moisture via evapotranspiration. The script currently uses spring (1), summer (2) and autumn/fall (3) as categories, but these changes don’t happen instantly, as it takes a few days for buds to flush, senescence to set in, etc. So I also added a ‘spring/summer transition’ (sprummer, if you will) option (season = 1.5) as the mean between those seasons. I suppose I should also add a ‘sumautumn’ season (2.5) at some point for the early fall period, but haven’t yet.


Wotton-Beverly2007_Fig5

(From Wotton & Beverly 2007; International Journal of Wildland Fire 16:463-472)

There are main effects and interaction effects associated with most of those variables, which alter the relationships at different variable levels. In most cases the interactions make sense, but not always. For instance, stand density is significant, with light and moderate density stands having lower mc than dense stands in most conditions. This makes good sense – sun and wind can penetrate lower density stands more easily and contribute to more rapid drying of the litter. But the effect diminishes under very dry conditions. This also makes sense, as several studies have found that overstory density can slow down in-stand drying, but under the droughtiest conditions, the stand effect disappears almost completely. See Whitehead et al. (2008) for a good example from BC.

So the problem here is that above FFMC 93 or so, the density effect actually reverses, where the dense stands start having lower moisture than the light or moderate density stands (above FFMC 96.5, the light density factor also reverses, where light stands start having higher moisture than moderate stands). These are almost certainly a factor of sample size, as there were few measurements in light and dense stands, particularly under the driest conditions. It’s also important to note that the highest FFMC in the range of data was 96.

So we’ll have to explore some better options for extreme-FFMC conditions, but for now, the best option is probably to stick with the ‘moderate’ stand density parameter for FFMC > 93.0.

In the meantime, here’s the R code and a spreadsheet version. The most annoying part of working with the code is typing out all of the coefficients. There are a couple of ways the authors present the models, including one with interaction factors and a simpler one with individual coefficients, though greater in number (in the Appendix, 45 different equations are listed with all combinations of the categorical factors). I’ve used the latter, even though it might have been quicker to do it the other way. Anyhow, at least I’ve done that for you (typing out coefficients), even though you may find your own code more slick than what I’ve come up with. Along the way we need FFMC and DMC moisture content functions, so those are in there too.

So here it is in a ‘copy/paste’ format. I’ll get it up on GitHub one of these days. Or just use the Excel version, WBmc-calcs.xlsx.

WBmc_calcs.xlsx

#Wotton-Beverly (2007) moisture content model, for adjusting the FFMC estimate 
#using stand, density, season, and DMC variables.
#Requires FFMC, DMC, stand (1:5; deciduous, Douglas-fir, mixedwood, pine, spruce), 
#density (1:3; light, mod, dense), season (1:3; spr, sum, fall)
#season==1.5 represents spring/summer transition (uses half of spring, half of summer estimate)
#D.Perrakis, June 2020; daniel.perrakis@canada.ca

#base R - no packages required

#create WB-mc function
#FFMC, DMC, stand, density, season

wbmc<-function(ffmc, dmc, stand, density, season) {
  #Get coefficients
  WBCoTr1 <-c(
       0.7299,0.0202,0.7977,0.8517,0.7391,
       0.4387,-0.271,0.5065,0.5605,0.4479,
       -0.2449,-0.9546,-0.1771,-0.1231,-0.2357,
       0.1348,-0.5749,0.2026,0.2566,0.144,
       -0.1564,-0.8661,-0.0886,-0.0346,-0.1472,
       -0.84,-1.5497,-0.7722,-0.7182,-0.8308,
       0.1601,-0.55,0.2279,0.2819,0.1693,
       -0.1311,-0.8408,-0.0633,-0.0093,-0.1219,
       -0.8147,-1.5244,-0.7469,-0.6929,-0.8055)
  WBCoTr2 <- c(
       0.5221,0.6264,0.5042,0.3709,0.4285,
       0.7133,0.8176,0.6954,0.5621,0.6197,
       1.0462,1.1505,1.0283,0.895,0.9526,
       0.8691,0.9734,0.8512,0.7179,0.7755,
       1.0603,1.1646,1.0424,0.9091,0.9667,
       1.3932,1.4975,1.3753,1.242,1.2996,
       0.9495,1.0538,0.9316,0.7983,0.8559,
       1.1407,1.245,1.1228,0.9895,1.0471,
       1.4736,1.5779,1.4557,1.3224,1.38)
  co3 <- 0.002232
  
  #Create data frame for pulling coefs
  WBCo <-data.frame("co1"=WBCoTr1, "co2"=WBCoTr2)
  
  #Spring and Summer coefs for 'sprummer' model
  co_sp <- WBCo[1:15,]
  co_su <- WBCo[16:30,]

  #define mcF, mcD, ex.mod intermediate functions
  mcF<-function(ffmc){
    147.2*(101-ffmc)/(59.5+ffmc)
  }
  mcD<-function(dmc) {
    20+exp(-(dmc-244.72)/43.43)
  }
  ex.mod<-function(s1, s2, s3, ffmc, dmc) {
    exp(s1+s2*log(mcF(ffmc))+s3*mcD(dmc))
  }

  if(season==1.5) {
    #spring
    c1.sprD=co_sp[(density*5-4):(density*5), 1]
    c2.sprD=co_sp[(density*5-4):(density*5), 2]
    c1=c1.sprD[stand]
    c2=c2.sprD[stand]
    mc.spr=ex.mod(c1, c2, co3, ffmc, dmc)   
    #summer 
    c1.sumD=co_su[(density*5-4):(density*5), 1]
    c2.sumD=co_su[(density*5-4):(density*5), 2]
    c3=c1.sumD[stand]
    c4=c2.sumD[stand]
    mc.sum=ex.mod(c3, c4, co3, ffmc, dmc)  
    
    #final 'sprummer' mc calc
    return(mean(c(mc.spr, mc.sum)))
    
  #for all others - spring, summer or fall
  } else {
    c1a=WBCo$co1[(season*15-14):(season*15)]
    c2a=WBCo$co2[(season*15-14):(season*15)]
    c1b=c1a[(density*5-4):(density*5)]
    c2b=c2a[(density*5-4):(density*5)]
    c1c=c1b[stand]
    c2c=c2b[stand]
    return(ex.mod(c1c, c2c, co3, ffmc, dmc))
  }
}
    
#[End]
#

#mcF, mcD functions on their own to get estimated #moisture contents from FFMC, DMC
mcF<-function(ffmc){
    147.2*(101-ffmc)/(59.5+ffmc)
  }
mcD<-function(dmc) {
    20+exp(-(dmc-244.72)/43.43)
  }
#[End]

#Works as far as I can tell
#e.g. FFMC 90, DMC 55, pine stand (4), moderate #density (2), summer (2); then compare with #sprummer and spring: 
#
#(Text below represents the R console, not code, #so don't copy it!
> wbmc(90, 55, 4, 2, 2)
[1] 10.50674
> wbmc(90, 55, 4, 2, 1.5)
[1] 9.420716
> wbmc(90, 55, 4, 2, 1)
[1] 8.334695
#Also, FFMC model alone, for comparison
> mcF(90)
[1] 10.83077


Finding fire articles and documents

So maybe you’re in university, working on your Master’s. In that case, you may have one of the world’s finest repositories of paper and digital records available to you, in the form of the university library. You have access to all the latest journals – IJWF, CJFR, FEM, Fire, Fire Ecology. But even then – you’re unlikely to know where to go for all of the government documents, or maybe you’re on the hunt for a key conference paper. These grey literature sources (ok, conference docs aren’t technically grey lit) often contain key information in fire science, and their value is sometimes only recognized years after the fact.

In this post, I’d like to highlight my own favorite search sources. I’d say that these days I probable can find 99% of what I’m looking for. Success rate drops off somewhat for really old documents (pre-1960 or so) but over time these are getting scanned as well.

1. Google Scholar. Need I say more? This baby pretty much singlehandedly revolutionized research disciplines when it came out, with its immense full-text access and ‘times cited’ links showing you where and how many times documents were referenced. I would say that its strength lies in access to recent publications (from 1-10 years old), as Google does a good job of automatically updating and referencing. Current ‘in press’ stuff is often missing, so for really current articles, you often have to go to the actual journal page and look for ‘current issue’ or whatever.

2. Treesearch. This isn’t necessarily my #2 go-to spot, but works well for US Forest Service sources, letting you search for all those General Technical Reports (GTRs), Research Papers (RPs), Proceedings documents (Ps) and so on, by number, research station and type. I’ve been witness to two institutional library shutdowns in my short career, and the printed versions of these old reports are bulky and seem to sometimes be of dubious value; I hope the US Forest Service and other agencies recognize the value of the older documents and continue to scan and archive the older reports because sometimes it seems like the pre-1980 stuff is still unlikely to be in digital form.

3. Along a similar vein, the CFS Publications site is the go-to page for classic Canadian fire sources from the CFS, including papers from CFS authors published in various other journals and formats (ie, it has much more than just CFS Information and Technical Reports). Find all those old J.G. Wright, H.W. Beall, C.E. Van Wagner and other working documents up here. I’ve found most of what I was looking for in terms of old Canadian fire arcana, but some authored materials are unfortunately still missing. I guess it’s impossible to keep track of everything.

4. Ok, for general fire papers that don’t meet the above criteria, or if you checked the government sites and came up empty-handed, the Fire Research Institute is an excellent and little-known repository. Thanks to Jason Greenlee for putting this together. The site claims to contain over 168,000 articles (as of time of writing), and appears to be a labour of love, but of excellent quality. When Jason is ready to retire, I hope this site gets taken over by an appropriate institution, as it has a lot of value.

5. ResearchGate. Social media meets academic research – it’s a novel concept, though I know it rubs some people a bit wrong. Also known as a good place to get articles that are copyrighted and aren’t open access! The ‘questions’ and ‘jobs’ links are pretty unique, and I think if you were a young person looking for an academic position and willing to travel abroad this would be an excellent way of finding out about obscure job postings. I believe the company itself is German, and it doesn’t seem to be updated quite as often as you would think, given how current social media tech is these days. I think they may have had some legal trouble with posting copyright materials. In any case, enjoy it for what it is – post your thesis, recommend a paper, leave a comment with your favorite researcher, check out that posting at the University of Uzbekistan.

6. FRAMES, the Fire Research and Management Exchange System, is kind of a neat one too. The main reason I go here is because it packages things by project. So if you want to see both the documentation and software associated with a computer model, FRAMES may have a page dedicated to it. It’s also very good for US research papers from 1990s-today that may not be open access.

7. Sci-hub. If all else fails, or if you’re an anarchist type, this is the pirate-guerilla warfare approach to research documents. ‘Bring knowledge to the people’, said its author, and a recent article suggests the site contains over 64 million papers. That’s a lot of science. It’s repeatedly threatened with legal action by the likes of Elsevier, and has been shut down several times (but has risen from the ashes each time). Its format, where you paste a link in the main search window, seems prone to failure but I’ve used it on occasion with some success.

Happy searching! I’ll try to update this periodically to keep it current.

EOSDIS Worldview – opportunistic tool for capturing fire runs

I’ve recently discovered the Earth Observing System Data and Information System (EOSDIS) Worldview app. Although it doesn’t bring any new data to the table, like Google Earth, having beautiful imagery available and easily accessed can be a game-changer.

Chukegg fire, Alberta, threatening High Level (26 May, 2019):

Chukegg2019

Lava Canyon fire, late run, BC Chilcotin 2009: LavaCanyon2009-8-27

And finally, I recently came across another NASA page that is very usable for active fire monitoring of hotspots, with worldwide coverage (nice for following the current Australian wildfires, for instance): FIRMS . I haven’t explored its capabilities yet, but it looks quite similar to the US GTAC Active Fire Mapping site, but in an easy web access format. Thanks, NASA!

ScreenHunter 186


CCP – Conifer Pyrometrics System

Ok, time for an update. Since I’ve started down this path, the FuelGraph project started as a fire and fuel type visualization tool. Then it became a way to compare models (FBP and CFIS), but some of the original authors of those models felt I was playing a bit fast and loose with fuel moisture concepts. Fair enough. (Just because the FFMC tries to estimate fine fuel moisture content doesn’t mean it actually does a good job, particularly across vastly different vegetation types.)

So a major change and increase in profile was in order. I had come up with a nifty way to link up a couple of models to get away from some FBP system constraints, but to make it actually credible requires quite a bit more analysis and documentation. That got me diving in headfirst to the original FBP System experimental burn documentation – the famed experiments at Sharpsand Creek and Porter Lake and Summit Lake (near Prince George).

At this point I feel like it’s starting to come together. At what ‘it’ is is now termed, rather pretentiously, the ‘Canadian Conifer Pyrometrics’ system. Well, it couldn’t be the Next Generation FBP System, because that name refers to another body of work (I do hope this CCP stuff eventually gets accepted enough to be integrated as an option within the NG-CFFDRS; the details definitely need to be worked out still). In a nutshell, it’s CFIS meets FBP with some tweaks and a simple surface model to tie things together, displayed and controlled (thus far) using FuelGraph.

Here’s the sneak preview, recently presented at the fabulous 6th Fuels & Fire Behaviour Conference (Marseille, France):

ResearchGate link

80652f39-7246-45e1-9832-7cc4e3e35226-e1561613750505.png

FuelGraph – not just FBPS anymore!

Update:

After working with this a whole bunch and some good discussions with Marty and Miguel, we came to the conclusion that it isn’t appropriate to equate FFMC-derived fine fuel moisture content (mc) with mc from Rothermel’s FBO tables. So I’ve deleted this version of FuelGraph. Combining a reanalyzed crown fire initiation model with a surface fire model and crown fire spread model (from CFIS), this is turning into a much larger project named Conifer Pyrometrics, gradually turning (I think) into a component of the Next Generation FBP System.

I haven’t deleted the post for posterity sake, but have deleted the FuelGraph version that included both. It turned out to be a bit intellectually dishonest, and I certainly wouldn’t want any fire behaviour forecasts or projections to be blown because of this.

****

I’ve made a major overhaul of the FBP Graph tool, and have added the new(er) Cruz, Alexander, and Wakimoto CFIS spread rate equations – crown fire occurrence (so-called passive and active) and ROS. Since the new stuff takes us beyond the realm of FBP, a name change was in order; thus, FuelGraph! See Graph 3 for the new stuff; only available with WS/FFMC (not ISI). This is a beta version, so if you find errors or weirdness, please let me know. The rest of the FBPS-fuel type-based functionality still exists in Graphs 1 and 2.

I envision this as a helpful tool for Canadian agency fire behaviour specialists or fuel management specialists who are playing with non-standard fuel types or planning fuel treatment scenarios. The CFIS equations include some options for showing crowning threshold confidence intervals as well as options for toggling between a couple of different input options.

For the final version (v.4.0) I may add a another feature or two, but at this point I’m pretty content with this thing. Let me know what you think. Anyone who wants to look under the hood can unhide the calculation sheets and unprotect the graphs – send a note if you’d like to do that and I could send the password.

FuelGraph 3.99

FNESS fuel trt - Titet-Treated_2016
Nice example of a thin-pine burn fuel treatment in a Ponderosa pine stand (photo courtesy of BC’s First Nations Emergency Services Society)

FBP Graph – now with fire type!

I finally got around to making some long-planned changes to FBP Graph, the MS Excel tool for comparing fire behaviour using the Canadian Fire Behaviour Prediction System.

The latest version has the subtle-but-significant change of showing (if the box is checked) fire type. That is, when checked, the graph lines now indicate three thresholds, in terms of ISI or wind speed: these are the crown fire initiation threshold (between surface fire and intermittent crown fire, or 10% Crown Fraction Burned, or CFB), the point at which CFB is 50%, and the threshold between intermittent and continuous crown fire (90% CFB). As with the rest of the FBP Graph tool, the point thresholds move around on the graph depending on fuel type, buildup index (BUI), and some other modifiers depending on fuel type.

ScreenHunter_08 Feb. 20 15.53

These thresholds are important for two reasons. As fuel consumption and spread rate increase, conifer crowns become involved in fire spread (according to the Van Wagner crown fire model), further increasing fire intensity. However, the only fuel type in the FBP System that demonstrates a change in spread rate as crown involvement increases is the C-6 type, which is in many ways the most sophisticated fuel type in the system. So it is important to note where along the lines changes in fire type occur, as these can show where one can expect sudden changes in fire behaviour.

A second reason for the importance of these thresholds is that predicted rate of spread may well be incorrect as fire type changes. As many authors have noted, at the onset of crown fire initiation, spread rate can increase more than threefold, as the flaming front is suddenly exposed to above-canopy ambient winds. This change is not reflected in sigmoidal ROS curves that most FBP fuel types have, so fire type thresholds can indicate where these curves oversimplify, and likely underpredict, spread rate. As always, using the FBP Graph tool for operational purposes assumes expert knowledge and training in fire behaviour prediction using the CFFDRS, and I make no guarantees about the accuracy of the outputs (but you know, if you think there are errors, please let me know so I can address them). The ISI or wind speed threshold is calculated to the nearest 1 unit (ISI or km/h); so fire behaviour calculators such as RedApp are more accurate, but this is still pretty accurate given the inaccuracy of the base measurements (precipitation, wind speed, etc.). Thanks for your interest.

FBPGraph_v3_0